Immunogenicity Assays
Immunogenicity Tier 1, Tier 2, Tier 3 Analyses Follow FDA GuidelinesSee your data in STATLIA MATRIX.
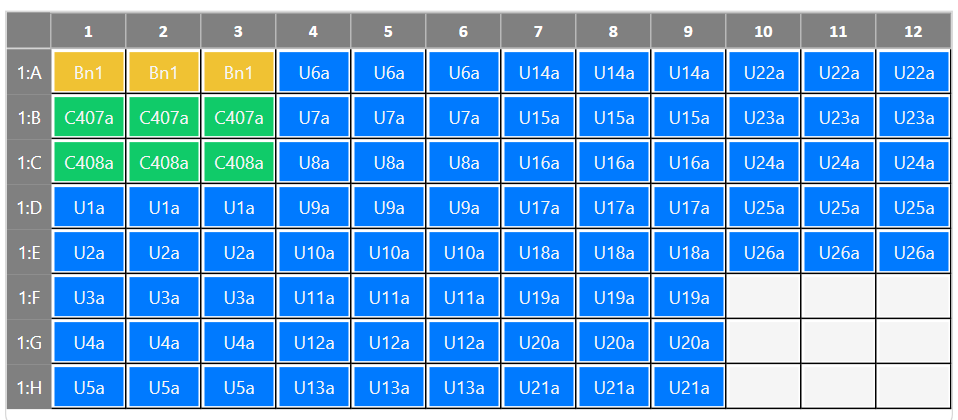
Complete Immunogenicity Testing For Your ADA Assays
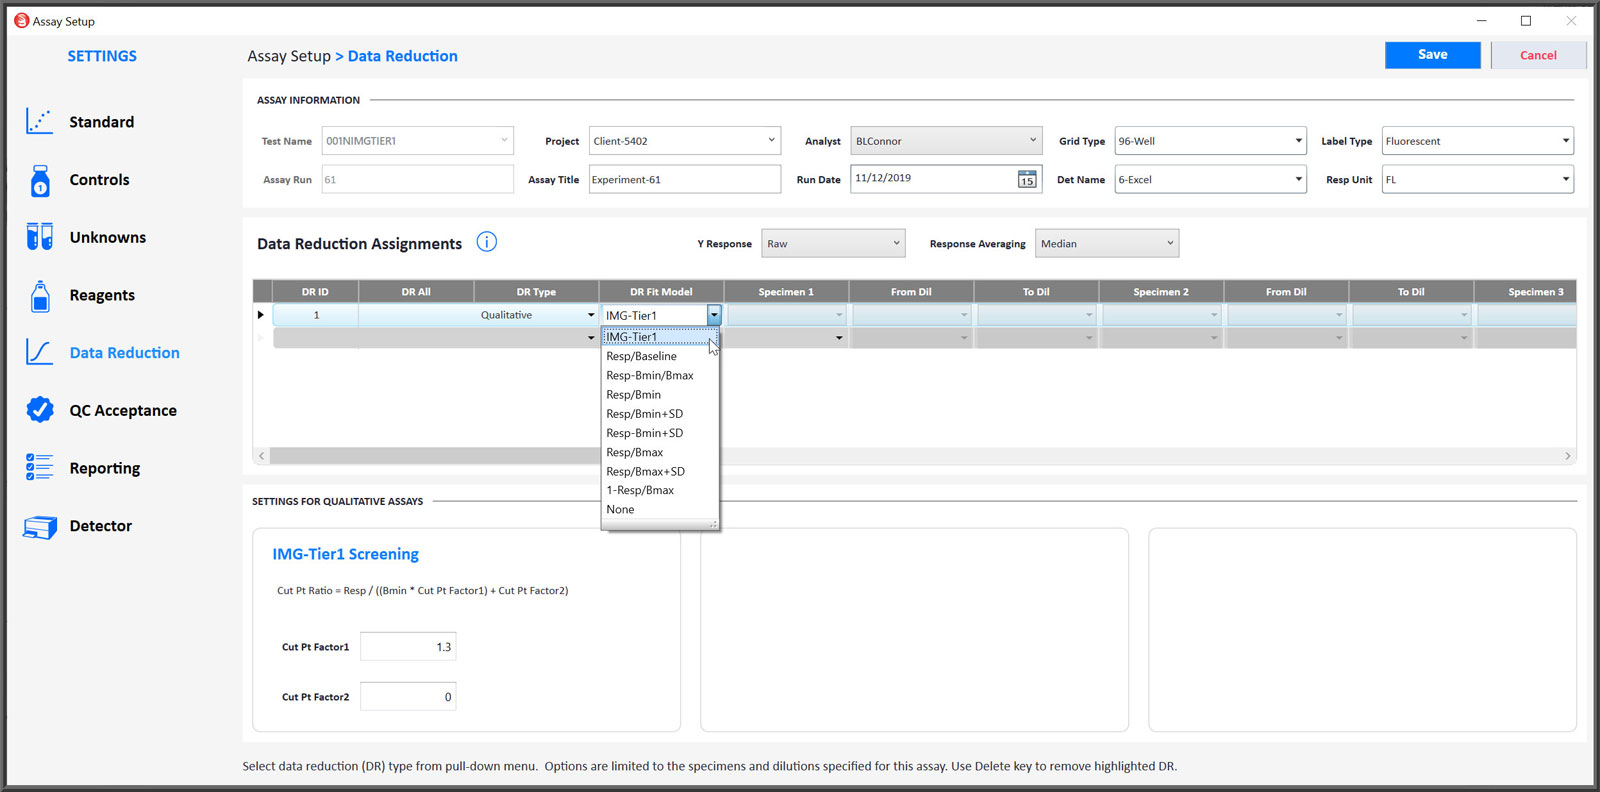
- Tier 1 Screening Assays use a cut point from negative controls times (or plus) a cut point factor to determine the cut point ratio. There are 8 additional Positive / Negative qualitative screening test formulas provided.
- Tier 2 Confirmatory Assays use test samples with and without the drug to determine the % inhibition from the anti-drug antibodies (ADA).
- Tier 3 Characterization Assays computes titer regression curves and a cut point from negative controls times (or plus) a cut point factor to determine the cut point titer of each test sample.
- STATLIA MATRIX computes a cut point factor from a pool of (naïve) unknown test samples after identifying and filtering out outliers. A cut point factor established by your laboratory can also be used.
- Naïve test samples are from patients who have never been exposed to the drug.
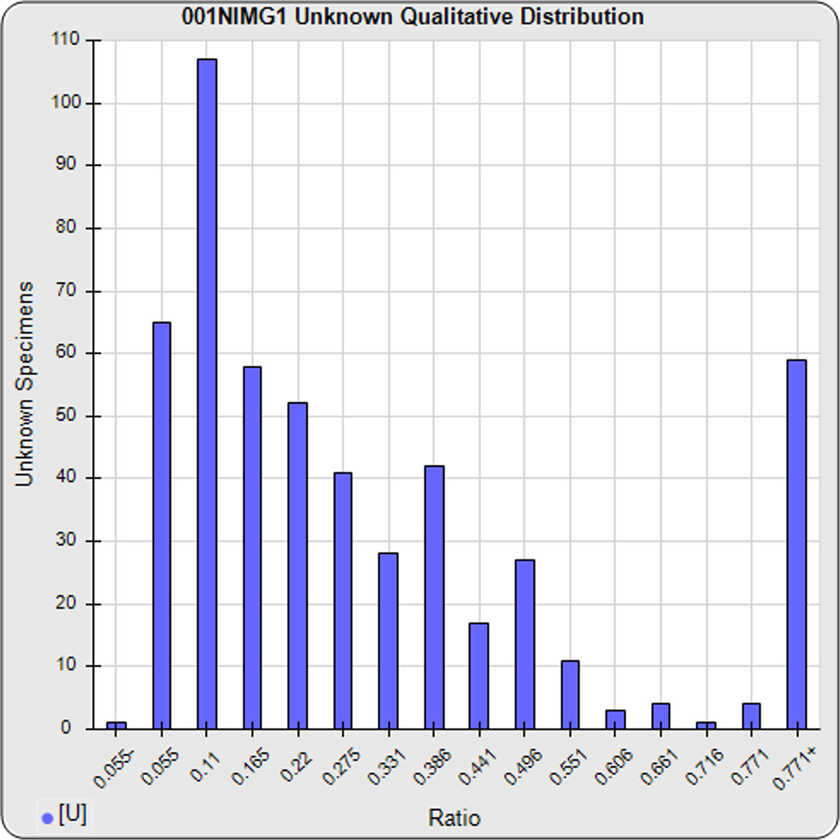
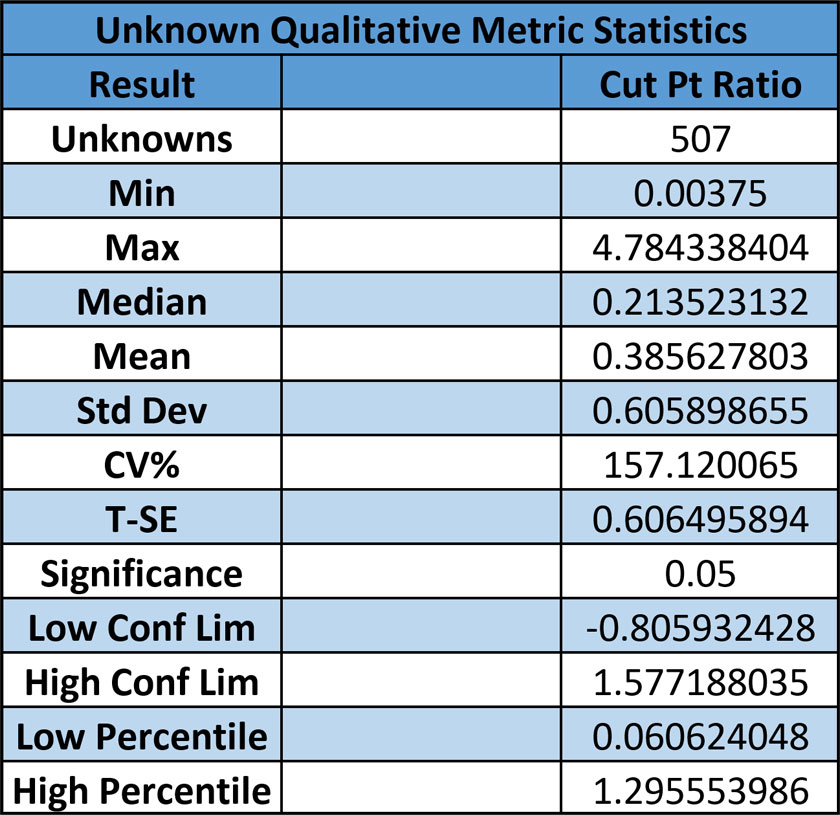
ADA Cut Point Factor Determined From a Pool of (Naive) Test Samples
STATLIA MATRIX determines the distribution of a pool of (naïve) unknown test samples after identifying and filtering out outliers. A cut point factor is then established from the upper confidence limit or high percentile at a selected significance level. A cut point factor established by your laboratory can also be used.
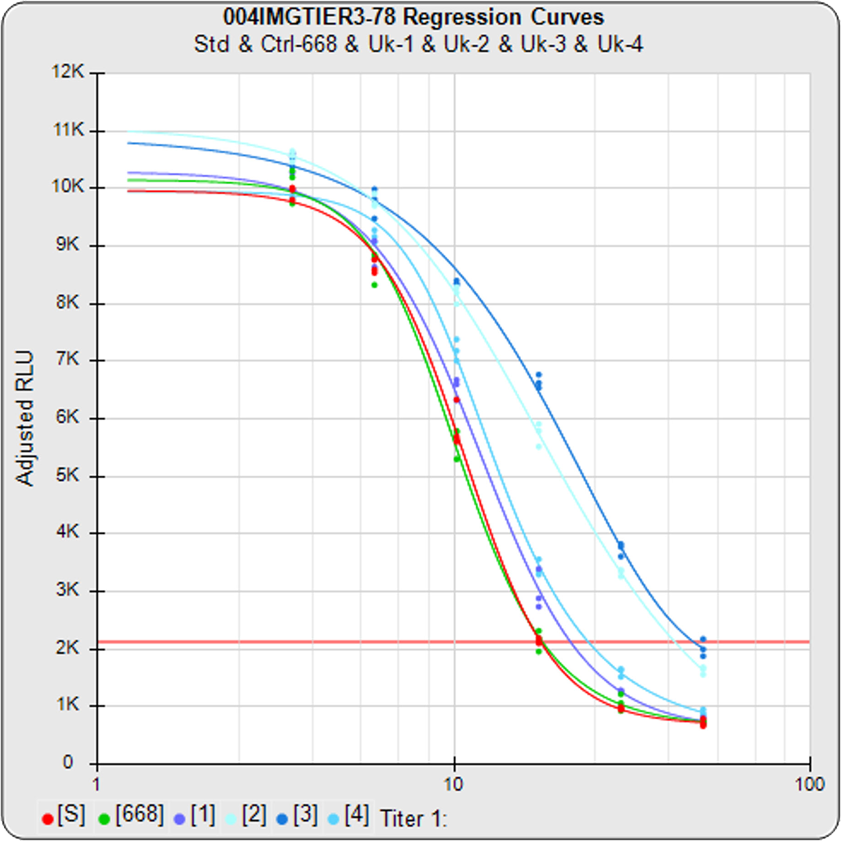
Full Regression Curves Establish the Cut Point Titer of Tier 3 Confirmatory Test Samples
STATLIA MATRIX computes titer regression curves and establishes a cut point from negative controls times (or plus) a cut point factor (red line) to determine the cut point titer of each test sample. An ED05, ED10, ED25, ED50, ED75, ED90, and ED95 estimated dose are also computed for each test sample.
All Of Your Positive / Negative Qualitative Screening Tests In One System
- There are 10 screening test options for determining a cut point ratio from a negative control (Bmin), a positive control (Bmax), or both.
- The equations for each screening test are displayed for each option in the settings section above entry boxes for the respective cut point factors used in the equations.
- The median of replicate samples can be selected instead of the mean when three or more replicates are run.

