Reliable Parallelism Thresholds Determined Automatically
STATLIA MATRIX automatically computes parallelism thresholds based on a pool of your previously run assays for Chi Square Method or Equivalence Method potency assays. The laboratory can also determine the parallelism thresholds using the pooled parallelism results conveniently organized in Excel tables.
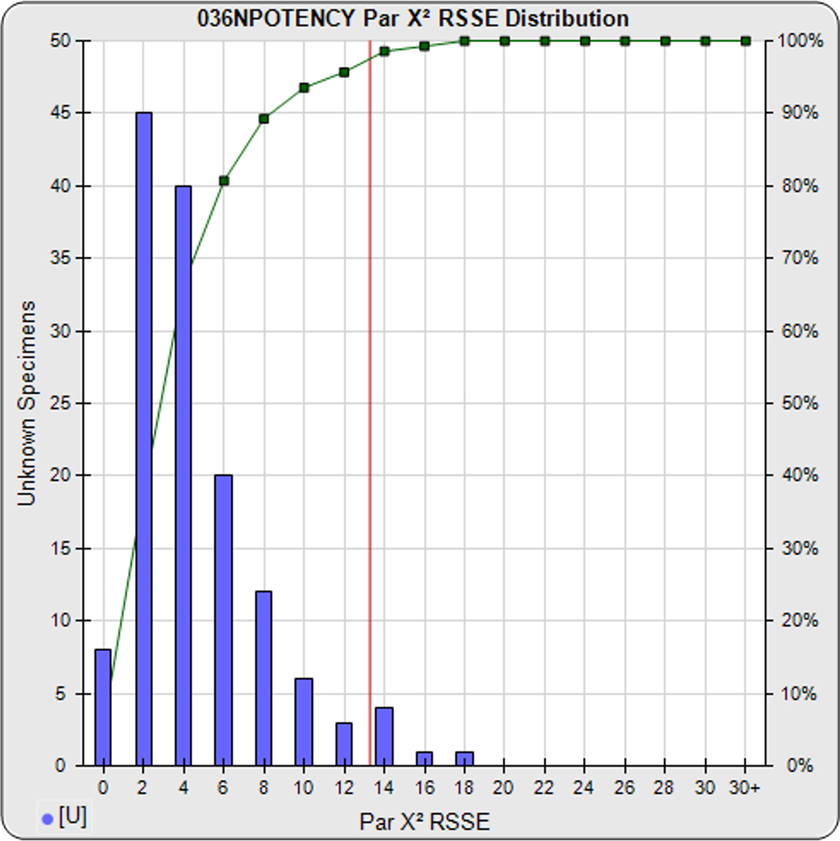
For the Chi Square Method (left graph), the parallelism threshold (red line) is determined from the nonparallel RSSE results from a pool of your previously run assays (blue bars). These RSSEs are a direct measure of similarity (parallelism) between the reference standard and test sample curves. You can set an RSSE parallelism threshold appropriate for your test, or set a significance level (e.g. 0.01) for these chi-square distributed RSSEs. The cumulative percentage of nonparallel RSSE results at each level are shown in green. To learn more, see the Chi Square Method manuscript: Measuring Parallelism, Linearity and Relative Potency in Immunoassay and Bioassay Data.
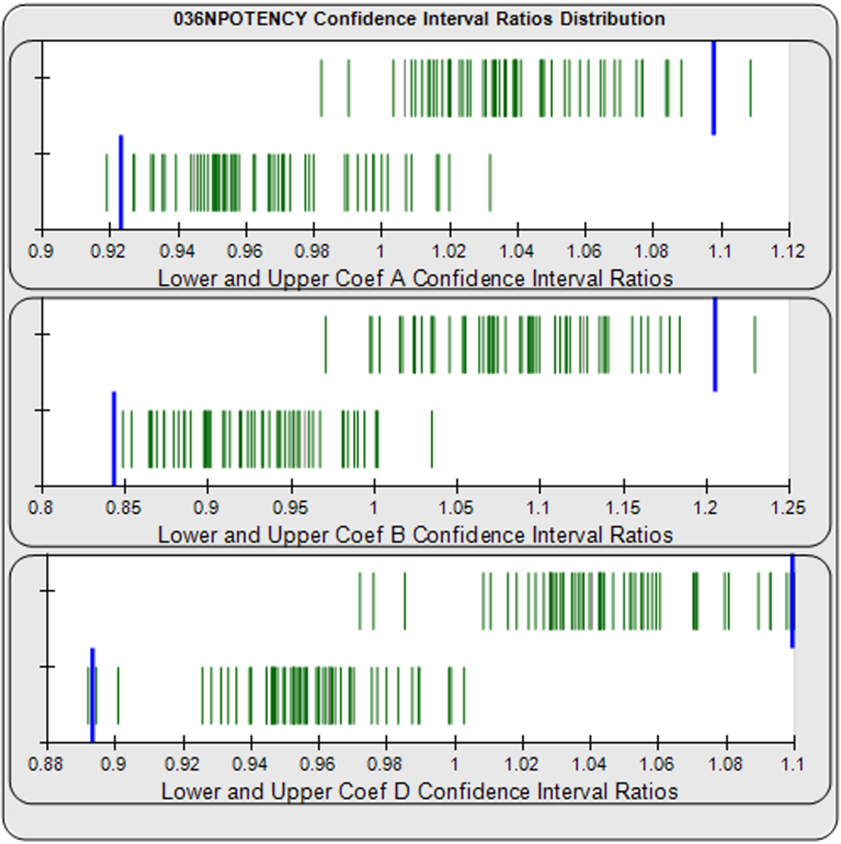
For the Equivalence Method (right graph), the ratio or difference deltas of the upper (top) and lower (bottom) confidence interval limits (green vertical lines) for the coefficients of each unknown/standard pair are computed from a pool of your previously run assays. The upper and lower goalpost borders (blue lines) are computed automatically as a percentile limit (e.g. 99th) of your pooled assay results. They can also be set by your laboratory. The confidence interval limits are determined using a Monte Carlo method, which is more stable and precise than linear approximation or profile method estimates (see Brendan Bioanalytics Tech Note: Monte Carlo Method).
To learn more, see the Case Study: 91 Potency Tests [LINK to Case Study] that show the threshold distribution graphs for both the Chi Square Method and the Equivalence Method for 91 tests.


