3 Parallelism Methods for Relative Potency Assays
The three approaches referenced in the USP 1032, 1033, 1034 and EP 5.3 guidelines to determine the parallelism between substances are the Equivalence Method (empirical test), RSSE (Chi-Square) Method (direct measure of parallelism), and the F Test (hypothesis test). STATLIA MATRIX offers advanced computations for all three with unique, informative graphs that make parallelism determinations simple and clear to see. Even the most difficult potency assays are easily handled.
For a performance analysis of the RSSE (Chi Square) Method and Equivalence Method with 91 different test methods, see the case study 91 Potency Examples.
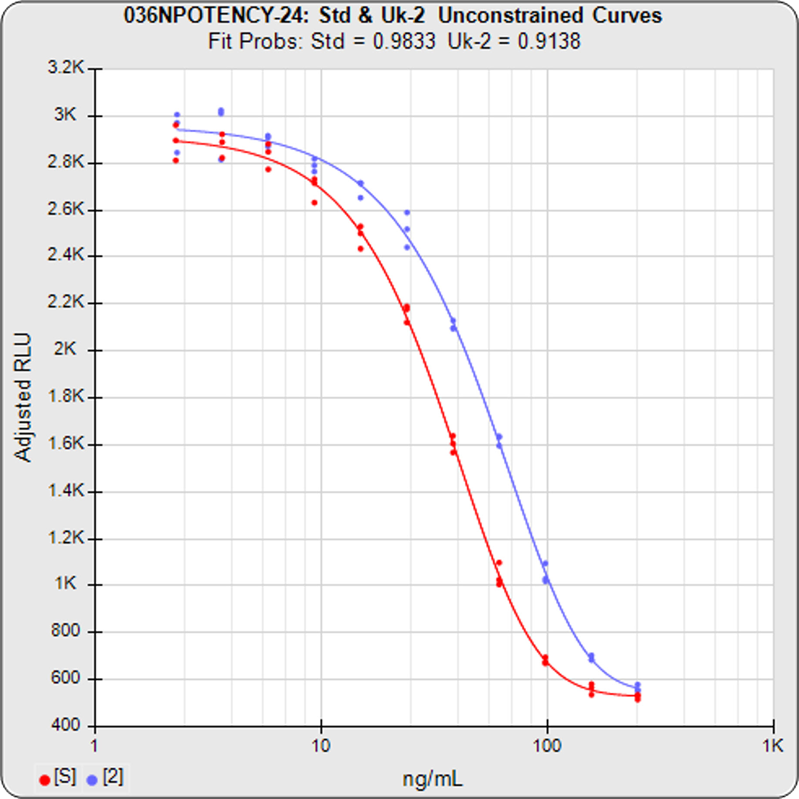
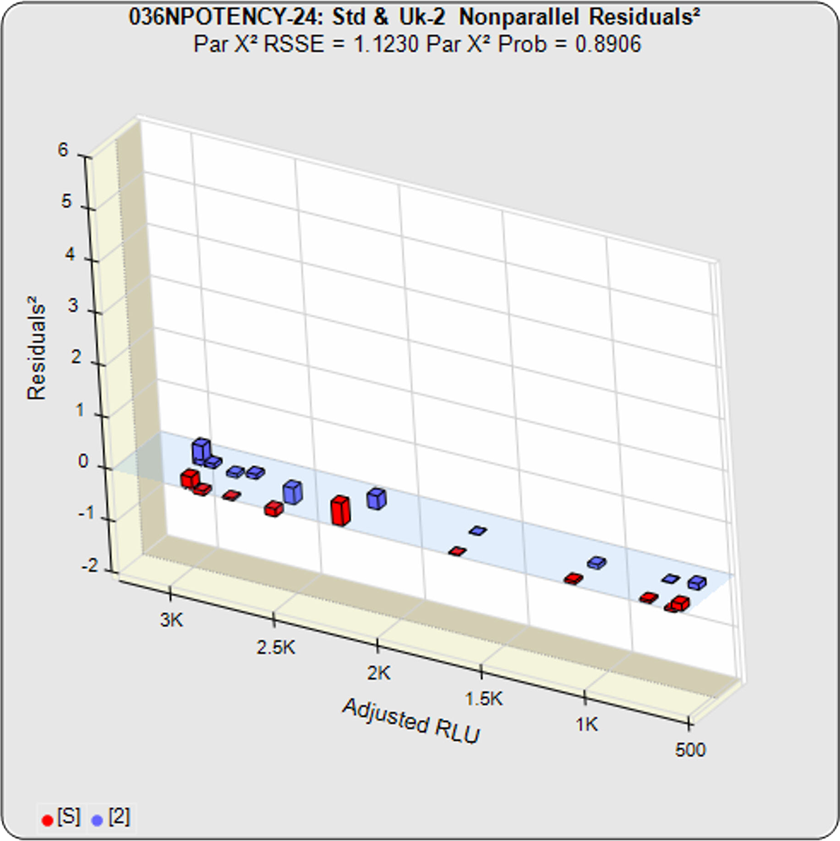
The RSSE (Chi-Square) Method and the F Test both utilize the residual method from regression statistics. The total RSSE (residual sum of squares error) of the two unconstrained curves in the first graph is subtracted from the total RSSE in the constrained curves (both data sets fit to the same, i.e. parallel, shape). This difference between the unconstrained and constrained RSSEs in the RSSE (Chi Square) Method is a direct measure of the amount of nonparallelism between the two curves (low RSSE difference = 1.1230 in second graph).
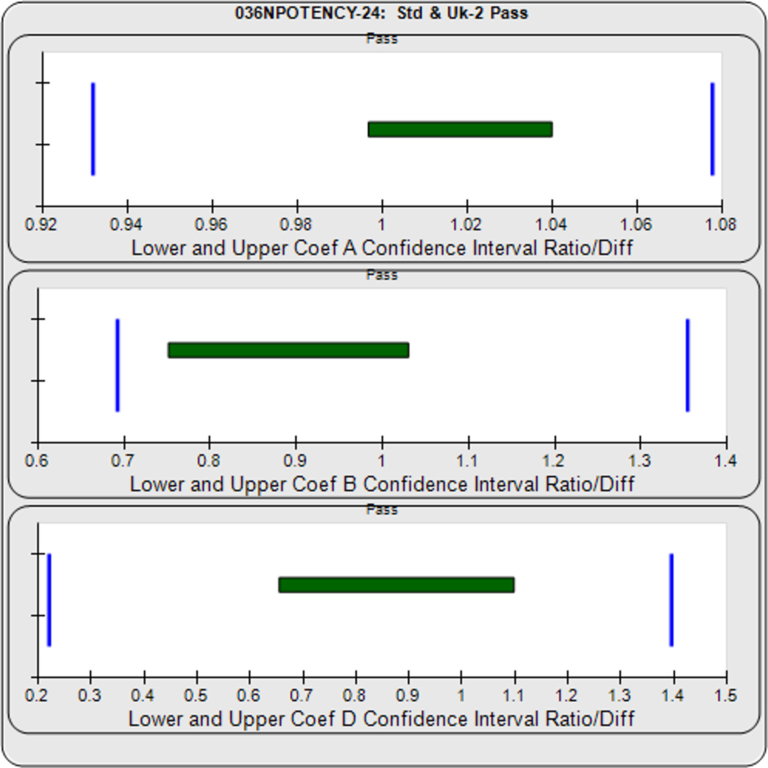
With the Equivalence Method, STATLIA MATRIX computes stable and precise confidence intervals (green bars in graph on right) for each coefficient. The software determines the goalpost borders (vertical blue bars) automatically from the lab’s pooled previously run assays. The lab can also enter their own borders.
Reliable parallelism. Pass/Fail acceptance. Easy to see.


